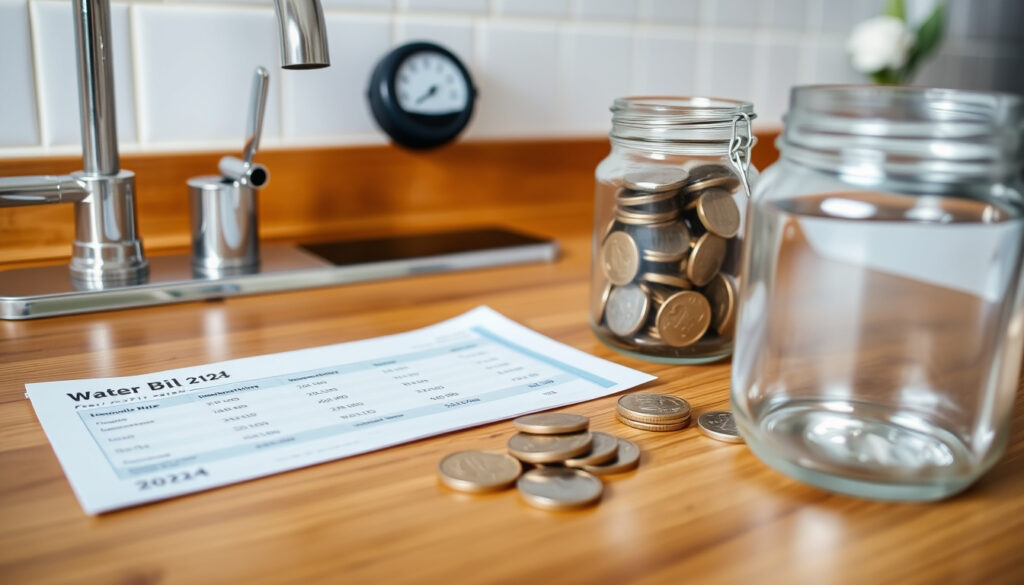
Average Water Bill UK – 2024 Costs by Region and Savings Tips
Water bills represent one of the most predictable household expenses in the United Kingdom, yet the amount households pay varies considerably depending on where they live, how their property is metered, and recent regulatory changes. Understanding what constitutes an average water bill—and what drives differences across regions—can help consumers assess whether they are paying a fair rate and identify opportunities for savings.
For the 2024/25 billing period, the national average annual water and wastewater bill in England and Wales stands at approximately £473 per household, translating to around £39.42 each month. However, this figure masks significant variation between suppliers, with some customers paying substantially more or less depending on their water company and regional circumstances.
What is the Average Water Bill in the UK in 2024?
The £473 annual average reflects combined charges for clean water supply and wastewater services. This headline figure, however, represents a snapshot that obscures important distinctions between billing methods, household types, and geographical location. Customers on metered tariffs generally find their bills fall below this average, while those on unmetered arrangements may pay more or less depending on property characteristics.
Key Insights
- Northumbrian Water offers the lowest annual bill at £426, while Wessex Water customers pay the most at £556
- Metered households typically spend between £35 and £45 per month depending on usage patterns
- The upcoming 2025/26 billing year will see the national average rise to approximately £603, an increase of £123 from current levels
- Regional disparities mean customers in the South West and Southern England face the steepest bills
- Scotland operates a different system, with water charges embedded within council tax rather than billed separately
- Switching to a meter can save households of one to two people around 25% on their water costs
- Average household consumption ranges from 100 to 150 cubic metres annually
Water Bills by Supplier (2024/25)
| Company | Annual Bill | Monthly |
|---|---|---|
| Northumbrian Water | £426 | £35.50 |
| Hafren Dyfrdwy | £447 | £37.25 |
| Severn Trent Water | £457 | £38.08 |
| Yorkshire Water | £467 | £38.92 |
| United Utilities | £486 | £40.50 |
| Thames Water | £488 | £40.67 |
| Scottish Water | £490 | £40.83 |
| Southern Water | £478 | £39.83 |
| Dŵr Cymru Welsh Water | £503 | £41.92 |
| South West Water | £520 | £43.33 |
| Anglian Water | £527 | £43.92 |
| Wessex Water | £556 | £46.33 |
Water-only companies bill separately for sewerage services, with charges ranging from £120 annually at Portsmouth Water to £286 at Essex and Suffolk Water. Customers of these suppliers receive a separate bill for wastewater services from their regional water company.
How Do UK Water Bills Vary by Region?
Geographic location represents the single largest factor driving differences in water bills across the UK. The water sector operates as a set of regional monopolies, with each company responsible for a specific geographical area. This structure means consumers cannot switch suppliers to reduce costs, making it essential to understand how regional factors influence pricing.
England and Wales
England and Wales together operate 17 water and wastewater companies, each regulated by Ofwat. Prices in these regions are set through periodic price reviews, with the most recent determination covering the 2024–2030 period. Companies in the South West, including South West Water and Wessex Water, consistently rank among the most expensive suppliers due to higher infrastructure costs and lower population density in their service areas.
Scotland
Scotland operates under a fundamentally different model. Rather than receiving separate water bills, Scottish households pay for water services through their council tax. The amount varies based on the council tax band assigned to the property. Scottish Water reports indicate that bills are set to rise by approximately 9% in the 2026/27 financial year, a figure that will be reflected in council tax demands.
The gap between the cheapest and most expensive suppliers amounts to £130 annually. These differences stem from varying infrastructure ages, population densities, investment requirements, and terrain challenges. Ofwat caps the total revenue companies can collect but allows them flexibility in how they structure individual charges within those limits.
Northern Ireland
Northern Ireland maintains its own water utility, NI Water, which operates independently of the England and Wales regulatory framework. Bills in Northern Ireland are typically paid through rates rather than direct charges, making direct comparisons with Great Britain figures difficult.
How Are Water Bills Calculated in the UK?
Water bill calculations in England and Wales follow one of two distinct models, each with its own methodology for determining charges. The approach applied to a particular property depends largely on whether it has a fitted water meter.
Metered Billing
Properties with water meters are billed according to actual consumption. The calculation multiplies the volume of water used, measured in cubic metres, by the company’s unit rate, then adds any fixed standing charges. The formula follows:
Total Bill = (Usage in m³ × Unit Rate) + Standing Charge
Unit rates typically range from £1.50 to £3 per cubic metre, while standing charges add between £20 and £50 annually. Suppliers read meters every six months, though customers can submit their own readings to ensure accurate billing. The typical household uses between 100 and 150 cubic metres of water each year, though this varies significantly based on family size, property type, and water-saving measures in place.
Unmetered Billing
Properties without meters are charged based on the property’s rateable value or a banding system linked to the number of occupants. This approach means households pay a fixed amount regardless of actual consumption. For low-water users, particularly single occupants in larger properties, unmetered bills can represent good value. However, households with higher consumption often find metered tariffs more cost-effective.
Most water companies offer free meter assessments, allowing customers to check whether switching would reduce their bills. If a metered household uses less water than the average unmetered property in their area—approximately £473 worth annually—switching typically results in savings. Many suppliers permit the switch but may require the property to have meter-compatible fittings.
Factors Affecting Your Bill
Beyond meter status, several interconnected factors influence what households pay:
- Household size: More occupants generally mean higher consumption under metered billing
- Property size: Unmetered bills often reflect property dimensions or assessed value
- Garden and outdoor use: Irrigation systems and swimming pools significantly increase consumption
- Leaking plumbing: A single running toilet can waste 200 litres daily, substantially raising quarterly bills
- Appliance efficiency: Dishwashers, washing machines, and older fixtures affect usage levels
Why Have Water Bills Increased in the UK?
Water bills have risen substantially over recent years, and projections indicate further significant increases through the remainder of the decade. Understanding the drivers behind these rises helps consumers contextualise their current and future bills.
Regulatory Price Reviews
Ofwat conducts periodic price reviews that determine the maximum revenue water companies can recover from customers. The 2024 price review, finalised in December 2024, sets new price limits taking effect from April 2025. These determinations reflect companies’ investment plans, inflation adjustments, and Ofwat’s assessment of efficient operating costs.
2025/26 Price Changes by Company
| Company | 2025/26 Bill | Increase |
|---|---|---|
| Southern Water | £703 | +£224 (47%) |
| South West Water | £686 | +£166 (32%) |
| Thames Water | £639 | +£151 (31%) |
The national average bill will reach approximately £603 in 2025/26, representing a £123 increase from current levels. By 2030, bills are projected to rise by a further £94 from 2024 figures. These increases are designed to fund infrastructure investment, but they will significantly affect household budgets.
Investment Drivers
Companies cite several factors justifying higher bills, including aging infrastructure replacement, leakage reduction targets, environmental compliance, and climate adaptation measures. The water sector has committed to substantial reductions in leakage and per capita consumption, requiring significant capital expenditure that ultimately appears in customer bills.
How Can You Reduce Your Water Bill?
While structural changes to bills fall outside individual control, households have several options for managing their water costs. Proactive measures can substantially reduce consumption and lower quarterly payments.
Immediate Actions
- Request a free meter assessment from your supplier to determine potential savings
- Fix leaking taps and running toilets promptly—a continuously running toilet can waste 200 litres daily
- Install aerating showerheads and tap aerators to reduce flow without compromising performance
- Run dishwashers and washing machines only with full loads
- Consider water-efficient appliances when replacing old equipment
A five-minute shower uses considerably less water than a bath. Shortening daily showers by five minutes can save approximately £40 annually per person. Fixing a single leaky tap dripping once per second can save around £18 per year on water and wastewater combined.
Financial Assistance
Households struggling with water bills may qualify for social tariffs designed to support low-income customers or those with large families. CCW, the Consumer Council for Water, provides guidance on available support schemes and can assist customers experiencing difficulty paying their bills. Contacting your supplier directly to discuss payment options or requesting a bill review represents a practical first step.
For those comparing the cost of water to other household expenses, the landscape of financial products offers various approaches to managing regular bills. 0% Credit Card – Best Intro APR Offers for 2025 demonstrates how introductory rates can help smooth cash flow for recurring expenses, though using credit responsibly remains essential.
The Trajectory of Water Bill Increases
Understanding how water bills have evolved and where they are heading provides useful context for household budgeting. The following timeline captures key milestones in recent pricing history.
- 2021: Post-pandemic bill adjustments began as companies sought to recover deferred maintenance costs
- 2023: Ofwat conducted its periodic price review, setting parameters for 2024–2030
- April 2024: Initial increases of 6–10% took effect across most regions
- December 2024: Final 2025/26 price determinations confirmed by Ofwat
- April 2025: Substantially higher bills take effect, with some companies raising charges by over 40%
- 2026/27 onwards: Further increases projected, with an average 5.4% rise expected in 2026/27
The pace of increase has accelerated notably, with the gap between 2024/25 and 2025/26 representing the largest single-year jump in recent memory for many customers.
What We Know and What Remains Uncertain
Established Facts
- National average for 2024/25: £473 annually
- Ofwat regulates all major English and Welsh suppliers
- 2025/26 average confirmed at £603
- Southern Water increase: 47% (£703 total)
- Scotland uses council tax banding system
- Metered homes typically pay less than unmetered
Areas of Uncertainty
- Postcode-specific averages unavailable without supplier tools
- Future inflation impacts on final 2026/27 figures unclear
- Individual savings from switching depend on actual usage
- Company-specific changes beyond 2025/26 not yet announced
- Impact of proposed government reforms on long-term pricing unknown
The Broader Context of Water Pricing
Water pricing in the UK operates within a unique regulatory framework that balances investment needs against household affordability. Unlike energy markets where competition theoretically drives prices, water companies maintain regional monopolies. This structure means Ofwat’s role as economic regulator carries particular weight in determining what customers pay.
The sector faces competing pressures: aging pipe networks require extensive replacement, climate change demands investment in drought resilience and flood management, and environmental obligations require reductions in leakage and pollution. These legitimate needs translate into higher bills, prompting debate about how costs should be distributed between companies, shareholders, and consumers.
Consumer advocacy groups, including Water UK, monitor the sector on behalf of households and publish comparative data to help customers understand whether their bills reflect reasonable costs. The tension between necessary investment and affordability concerns defines much of the current debate around water pricing policy.
What Experts Say About Water Costs
“Water companies have a responsibility to provide essential services at fair prices while investing in infrastructure. The scale of the 2025 increases will be difficult for many households, particularly those already struggling with the cost of living.”
— Consumer Council for Water statement on 2025 price determinations
Regulatory assessments acknowledge that affordability represents a growing concern. Social tariffs and payment assistance schemes aim to protect vulnerable customers, though uptake remains uneven across regions and companies.
“The price review reflects the genuine cost of running a water system in the 2020s. Investment in resilience and environmental performance is unavoidable, but companies must also demonstrate efficiency and customer focus.”
— Ofwat guidance on the 2024 price review
Summary and Next Steps
Average water bills in the UK for 2024/25 stand at £473 annually, though this figure conceals considerable variation across regions, companies, and billing methods. Customers of Wessex Water pay the most at £556 per year, while Northumbrian Water customers enjoy the lowest bills at £426. The coming year will see substantial increases, with the national average rising to £603 in April 2025.
Households can take practical steps to manage costs: checking meter eligibility, fixing leaks promptly, reducing consumption through water-saving devices, and exploring financial assistance schemes. While structural pricing changes lie beyond individual control, proactive management of consumption can generate meaningful savings.
For those planning travel and managing household logistics, understanding baggage policies helps avoid unexpected costs. EasyJet Cabin Bag Size – Exact Limits, Rules and Fees provides detailed guidance on airline baggage allowances, illustrating how clear information enables better budgeting across different expense categories.
Frequently Asked Questions
What constitutes a high water bill in the UK?
Bills exceeding £50 per month or those showing sudden unexplained increases typically warrant investigation. Running toilets, concealed leaks, or meter reading errors can cause unexpectedly high charges.
How can I check my water bill average?
No comprehensive postcode-specific calculator exists publicly. Use your supplier’s website to input your details, or consult Ofwat’s comparison tools to benchmark against regional averages.
Do water bills differ between England and Scotland?
Yes. England and Wales use a company-based billing system with separate water and wastewater charges. Scotland embeds water costs within council tax, billed according to property band rather than measured consumption.
How much can switching to a meter save?
Households of one to two people typically save around 25% by switching to metered billing. The actual amount depends on consumption levels relative to the unmetered average for your property type.
What happens if I cannot afford my water bill?
Contact your supplier immediately to discuss payment options. Most companies offer payment plans, and social tariffs provide reduced rates for eligible low-income households. CCW can also provide advocacy support.
Are water bill rises the same across all companies?
No. Increases vary significantly by supplier, from a 2% decrease at Sutton and East Surrey to a 47% increase at Southern Water. Regional factors and company-specific investment requirements drive these differences.
How is Ofwat involved in water pricing?
Ofwat sets the maximum revenue water companies can recover from customers through periodic price reviews. Companies must demonstrate efficiency and meet service standards while delivering their approved investment programmes.
More related posts
 Black Mirror Season 7: Release Date, 6 Episodes, Cast & Trailer
 Liza Goddard Now: Biography, Family, and Current Life
 Christine Baranski Movies and TV Shows – Full Filmography and Awards
 Slug and Lettuce Glasgow: Is It Closed? Brunch & Location
 Renew Driving Licence at 70 – UK Guide and Steps
 FC Kairat Almaty vs Real Madrid Lineups: UCL 2025 Match Report
 Mike and the Mechanics – History, Members, Hits and Status
 Car Garages Near Me – Find Reliable Certified Shops
